I have been staring at anonymised usage patterns across our users in Germany and Austria, and one thing genuinely unsettled me.
You can tell what someone does for a living from their credit breakdown alone.
No survey. No onboarding call. No standing in a Munich co-working kitchen asking “so what is it you actually do” while you both pretend to enjoy the coffee. Just the shape of the data, quietly giving the whole game away.
That is mildly unsettling. It is also extremely useful. Because if a total stranger could read your business off your usage dashboard, so can you. The difference is that the stranger would bother to look.
Most people do not. They glance at the monthly total, feel briefly responsible about it the way you do walking past a gym, and close the tab. This whole piece is about that tab. There is a small fortune in business intelligence sitting inside it, and you are paying for it either way.
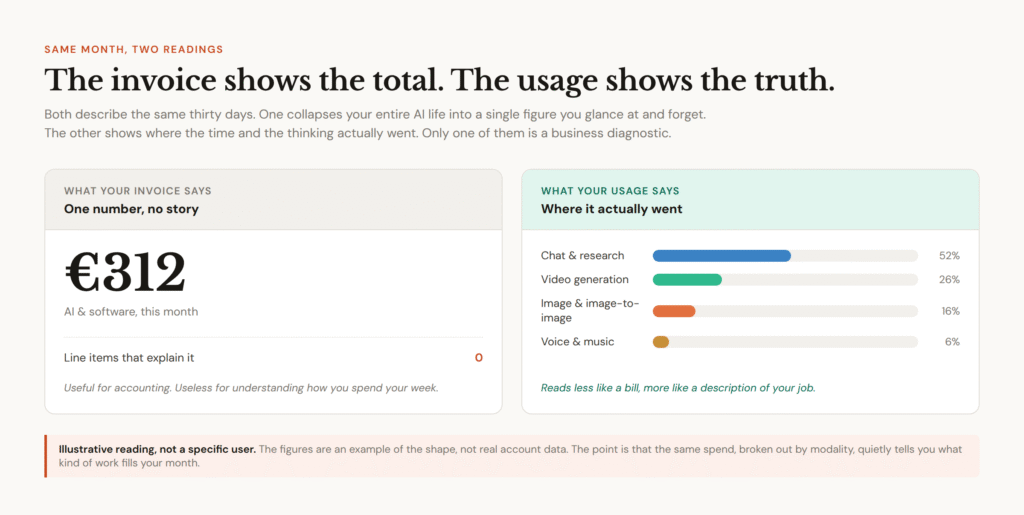
The Invoice Tells You What You Spent. The Usage Tells You What You Did.
An invoice is an honest document and a useless one.
It takes an entire month of your working life, crushes it into a single number, hands that number to your accountant, and tells you precisely nothing you can act on. You spent what you spent. Noted. Filed. Forgotten by Tuesday.
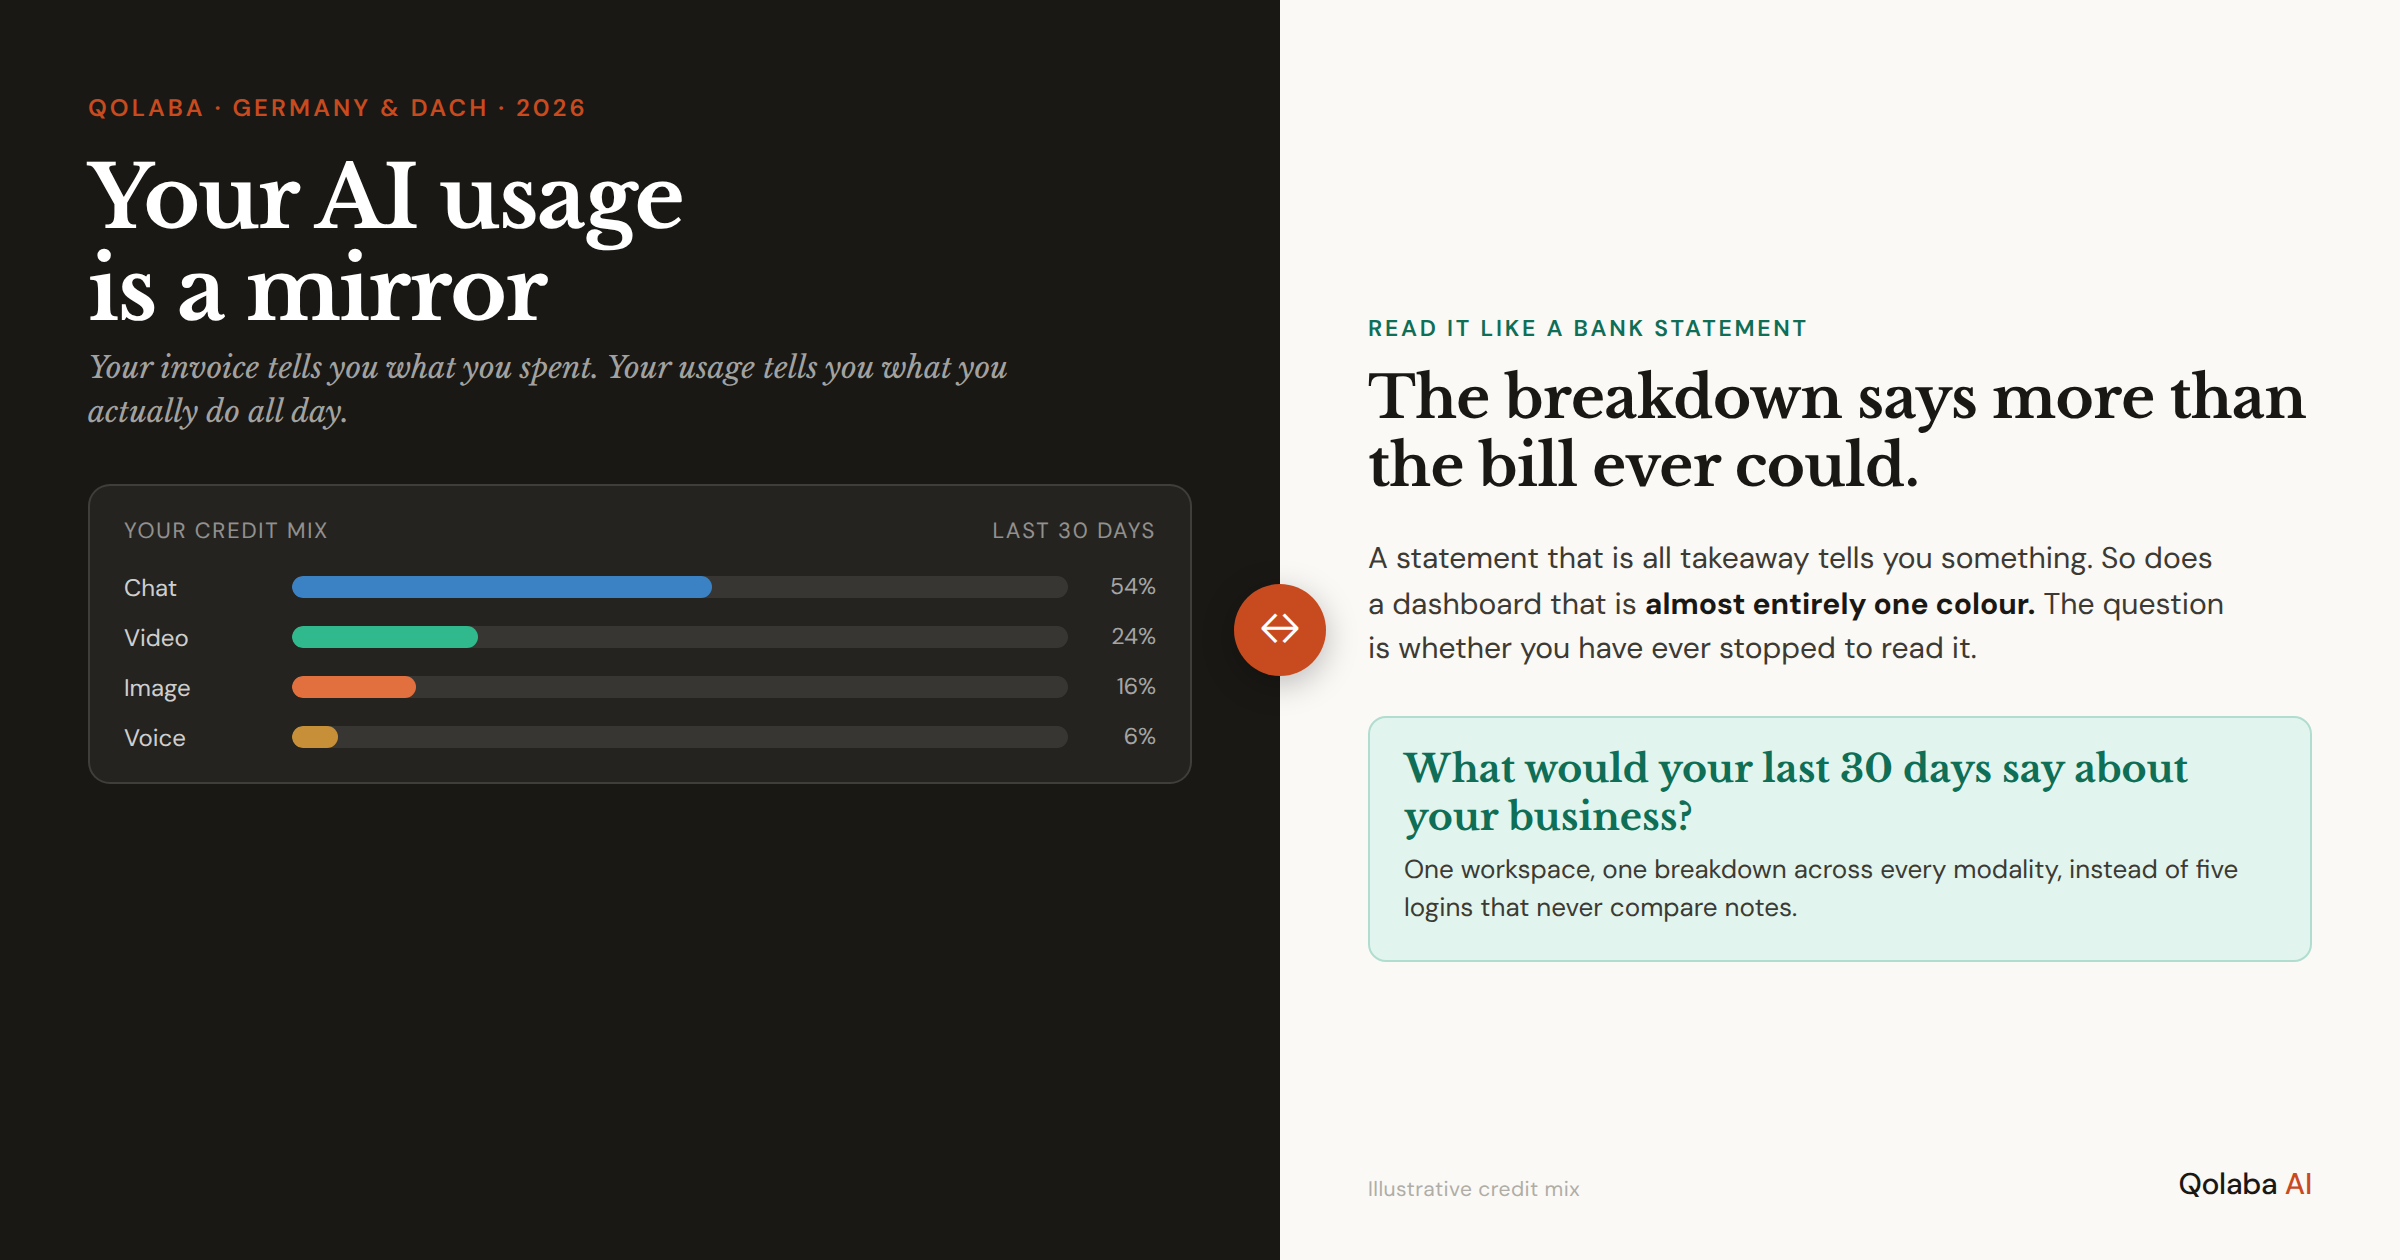
The usage breakdown is the same month, told properly. It shows where the spend actually went, split across the things you do: chat and research, image, image-to-image, video, voice and music.
And here is the trick. Each of those maps to a kind of work. So the breakdown quietly stops being a cost report and becomes a description of your job. One is a number. The other is a mirror. Only one has ever told anybody anything.
This is also why “what is the best value in AI for the price” is the wrong question to lead with. Price is the boring half. The useful half is what the spend reveals about how you actually run your week, which your invoice will take to its grave.
The Usage Fingerprint: You Are What You Generate
Here is what I mean about reading the job off the data.
Across the DACH cohort, the same shapes turn up again and again, and each one rats out a kind of business. Nobody filled in a form to be sorted like this. The credits did it for them, with no regard whatsoever for anyone’s feelings.
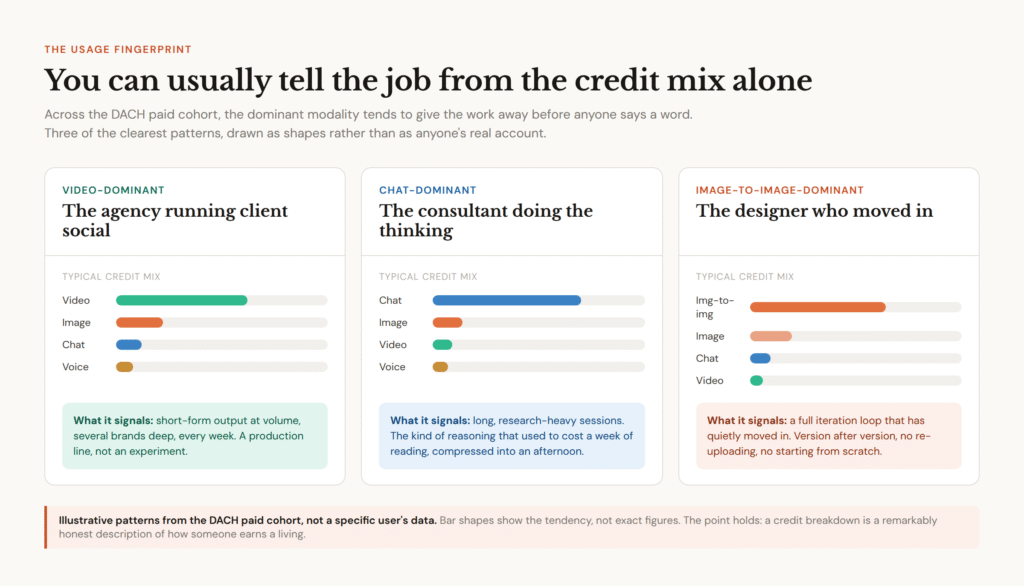
The agency running client social lives in video credits. A firehose of short-form, three brands deep, every single week. You can practically hear the content calendar weeping.
The consultant lives in chat credits. Long sessions, real back and forth, the kind of thinking that used to cost a week of reading and now costs an afternoon and a flat white.
The designer lives in image-to-image. Version after version after version, no re-uploading, no starting from scratch, just the quiet hum of someone who moved their entire iteration loop in and forgot to mention it to anyone.
If you want a cheat sheet for reading your own, here is the key. Each modality, what a heavy share of it usually means, and the slightly uncomfortable question it raises.
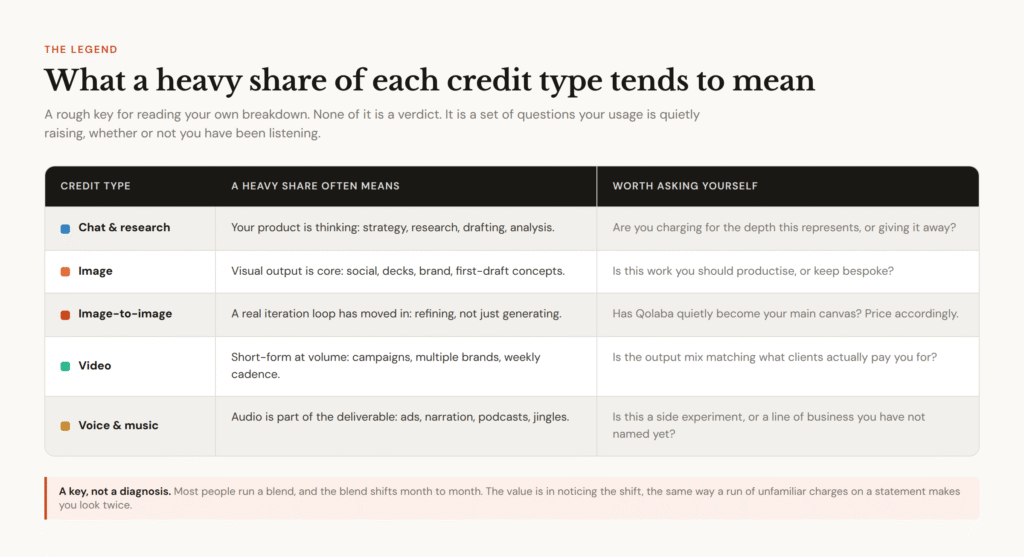
The point of the key is not to file you in a box. It is to make the obvious visible.
You already have a rough story in your head about how you spend your week. Your usage will either nod along or quietly call you a liar. The second one is where the money is.
Read It Like a Bank Statement (The Boring Habit That Works)
So here is the mental model worth stealing, and it is gloriously unglamorous.
Read your AI usage the way you read your bank statement. Not to total it up and feel a brief, cleansing wave of shame. To scan for where it is quietly going, and to spot the one line that does not fit.
A statement that is all takeaway tells you something about your month. A dashboard that is almost entirely one colour tells you the same thing, just with fewer regrets attached.
Think of it as your own private business analytics department. It has been working unpaid this entire time. A proper read takes five minutes and four questions: which colour wins, what is missing, where the spikes are, and what changed since last month.
The example below walks through one consultant’s thirty days, so you can see the method without having to meet the consultant.
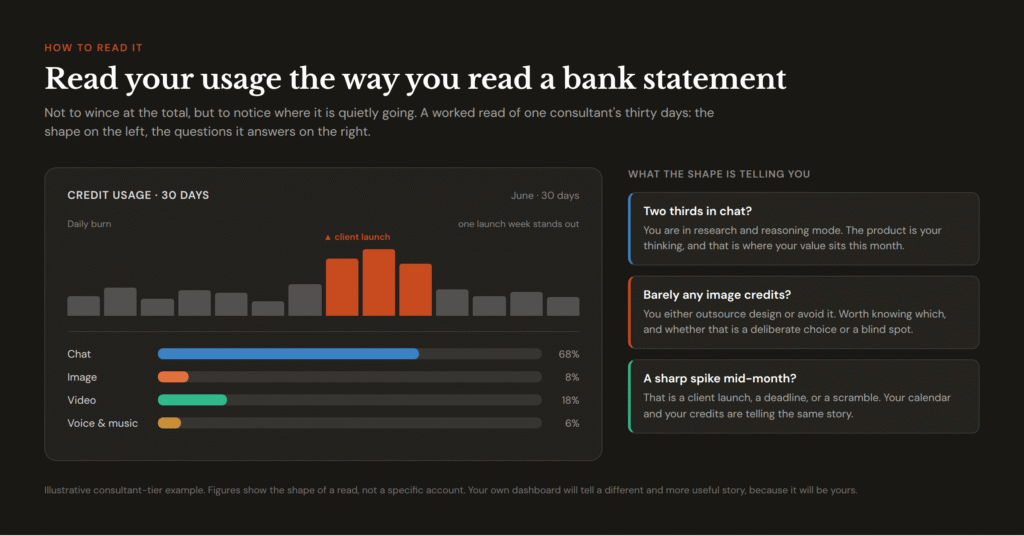
What makes this a business tool and not a party trick is what you do next.
Two thirds of your month in chat, and still not charging for depth? Raise your prices. A modality sitting at zero that you keep meaning to use? Decide whether that is focus or quiet avoidance. A side project that keeps showing up in the data but never on an invoice? Congratulations, you have a product you have not named yet.
The dashboard only points. The decision stays yours, which is the entire appeal and, occasionally, the entire problem.
“Your calendar tells you what you planned to do. Your usage data tells you what you actually did. When the two disagree, bet on the data. It has no reason to flatter you.”
Why Five Logins Will Never Show You This
There is a reason this kind of read is rare, and it is not that operators lack curiosity.
It is that most setups physically cannot draw the picture.
When your chat tool, your image tool, your video tool, your voice tool and your research tool are five separate AI subscriptions, each one hands you its own little dashboard. Own units. Own page. Own billing day. Own smug certainty that it is the only tool you really need.
Nobody opens five dashboards and adds them up by hand. Nobody has ever done this, in the entire history of work, voluntarily. A mirror in five pieces is not a mirror. It is a cleanup job, and it lives on the to-do list forever, just under “sort out pension.”
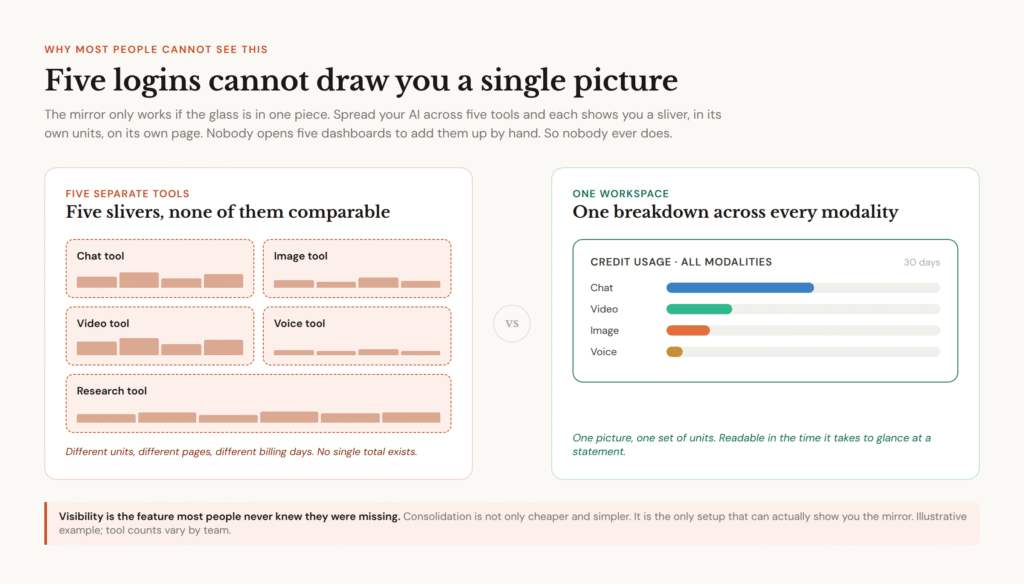
This is the quiet argument for an all in one AI platform that has nothing to do with shaving a few euros off your AI subscriptions, although that tends to happen anyway and nobody has ever filed a complaint about it.
Put chat, image, video, voice and research on one credit system, and suddenly there is a single breakdown across every modality, in one set of units, on one page. The picture exists because the data finally lives in the same postcode.
It turns out visibility was the feature everyone wanted and nobody knew to ask for.
| Why this shaped how we built the dashboard We did not add a usage dashboard to look thorough. We added it because it is the first honest answer to “where is my time actually going.” Qolaba runs every modality on one credit system across 60+ models, so your breakdown is a single readable picture instead of five tabs you will reconcile precisely never. That is the whole reason the read in this article is even possible. And because usage data is your data, the unglamorous guarantees matter: Qolaba does not train on your inputs, and provides an Auftragsverarbeitungsvertrag (AVV) for Teams and Business plan users. The mirror stays yours to look into, DSGVO and all. |
Now Go Read Your Own 30 Days
Enough about other people’s fingerprints. The only usage data that can change a decision is yours.
So treat this less as a conclusion and more as an instruction. Open your dashboard. Pull your credit breakdown. Actually look at it, with these five questions in hand.
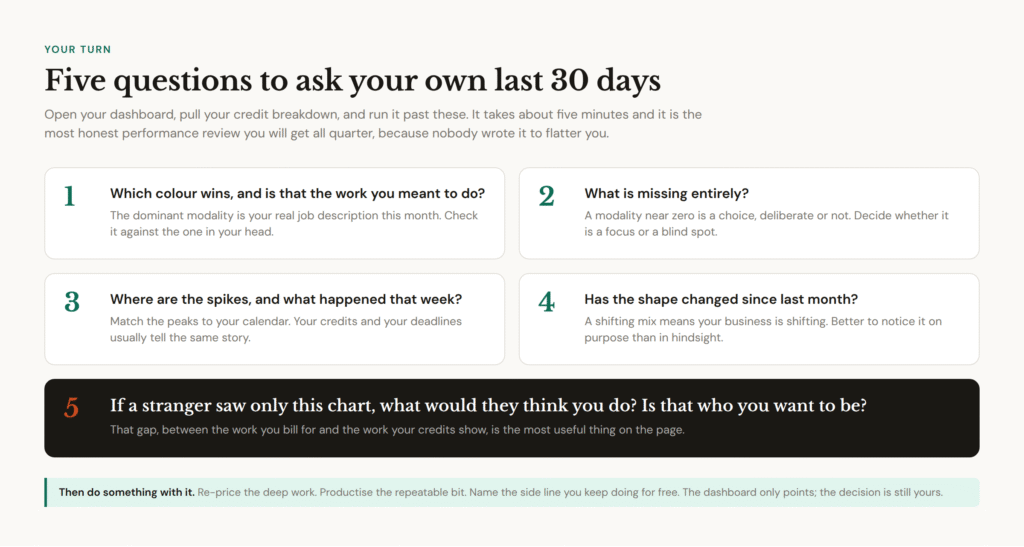
You will find one thing you expected and one thing you absolutely did not.
The first one means you know your business. Well done. The second one is the entire reason this exercise exists. That gap, between the work you think you do and the work your credits prove you do, is where most of next quarter’s good decisions are currently hiding.
What Operators Found When They Finally Looked
These come from the Qollective community and a few DACH founder forums, where people are refreshingly honest about what their own data told them.
None of the realisations are dramatic. That is the point. The mirror tends to show you something quiet and obvious that you simply never sat still long enough to notice.
“The most useful business report most operators own is the one their AI usage has been quietly writing every month, in the dark, for free, while they ignored it.”
More than your invoice ever will. The invoice gives one number; the usage breakdown shows where it went by modality, and because each modality maps to a kind of work, the mix describes how you spend your week. Heavy chat means thinking is your product. Heavy video means content production at volume. Heavy image-to-image means a design iteration loop has moved in. Read as a pattern, it is genuine business intelligence you are already paying for.
Like a bank statement. Not to wince at the total, but to notice where it is going. Ask which modality dominates and whether that matches the work you meant to do, what is missing entirely, where the spikes fall and what happened that week, and whether the shape has shifted since last month. The gap between the work you bill for and the work your credits show is usually the most useful thing on the page.
Neither, on its own. A dominant modality is information, not a verdict. The only question is whether it matches your intent. Two thirds of your credits in chat is brilliant if deep thinking is what clients pay for, and a quiet alarm if you meant to be shipping deliverables. The value lives in the gap between what the chart shows and what you assumed you were doing.
Only if your AI lives in one place. Spread across five tools, each shows a sliver in its own units and no single total exists. An all in one AI platform shows one credit breakdown across every modality, which is what makes the read possible at all. Qolaba runs on a single credit system across 60+ models and gives every user a usage dashboard as standard.
Especially then. The best AI tools for business are the ones that also tell you how you are using them, and for a solo operator or a small team that visibility is the difference between guessing at your own focus and actually seeing it. The usage read works the same whether you are one person or ten. The smaller you are, the more every hour shows up in the shape.
It depends on the provider, so check. For German business use, look for a published Auftragsverarbeitungsvertrag (AVV) for business users, a clear statement on whether inputs are used to train models, and data handling you can show a Datenschutzbeauftragter without breaking into a sweat. Qolaba does not train on user inputs and provides an AVV for Teams and Business plan users.