

You’ve invested in AI tools, integrated models, and empowered your teams. But as the excitement settles, a critical question emerges: Is our AI actually delivering value? How do we prove its impact, optimize its performance, and justify continued investment?
Without clear metrics and robust reporting, AI initiatives can feel like a black box – consuming resources without a clear return. This guide will show you how to define, track, and report on AI success, transforming vague promises into measurable business outcomes.
Why Tracking AI Impact is Non-Negotiable
Measuring AI’s success goes beyond simply counting queries. It’s about demonstrating tangible value to the business. Effective tracking allows you to:
- Justify Investment: Prove the ROI of your AI tools and resources.
- Optimize Performance: Identify what’s working, what’s not, and where to focus optimization efforts.
- Identify High-Value Use Cases: Replicate successful AI applications across the organization.
- Drive Adoption: Showcase success stories to encourage wider team engagement.
- Mitigate Risks: Monitor for unintended consequences or compliance issues.
Key Categories of AI Success Metrics

To comprehensively measure AI impact, consider metrics across several dimensions:
1. Operational Efficiency Metrics
These quantify how AI streamlines processes and reduces effort.
- Time Saved: Hours reduced in tasks like data analysis, content drafting, or customer support response.
- Example: “AI-powered content generation reduced drafting time for social media posts by 50%.”
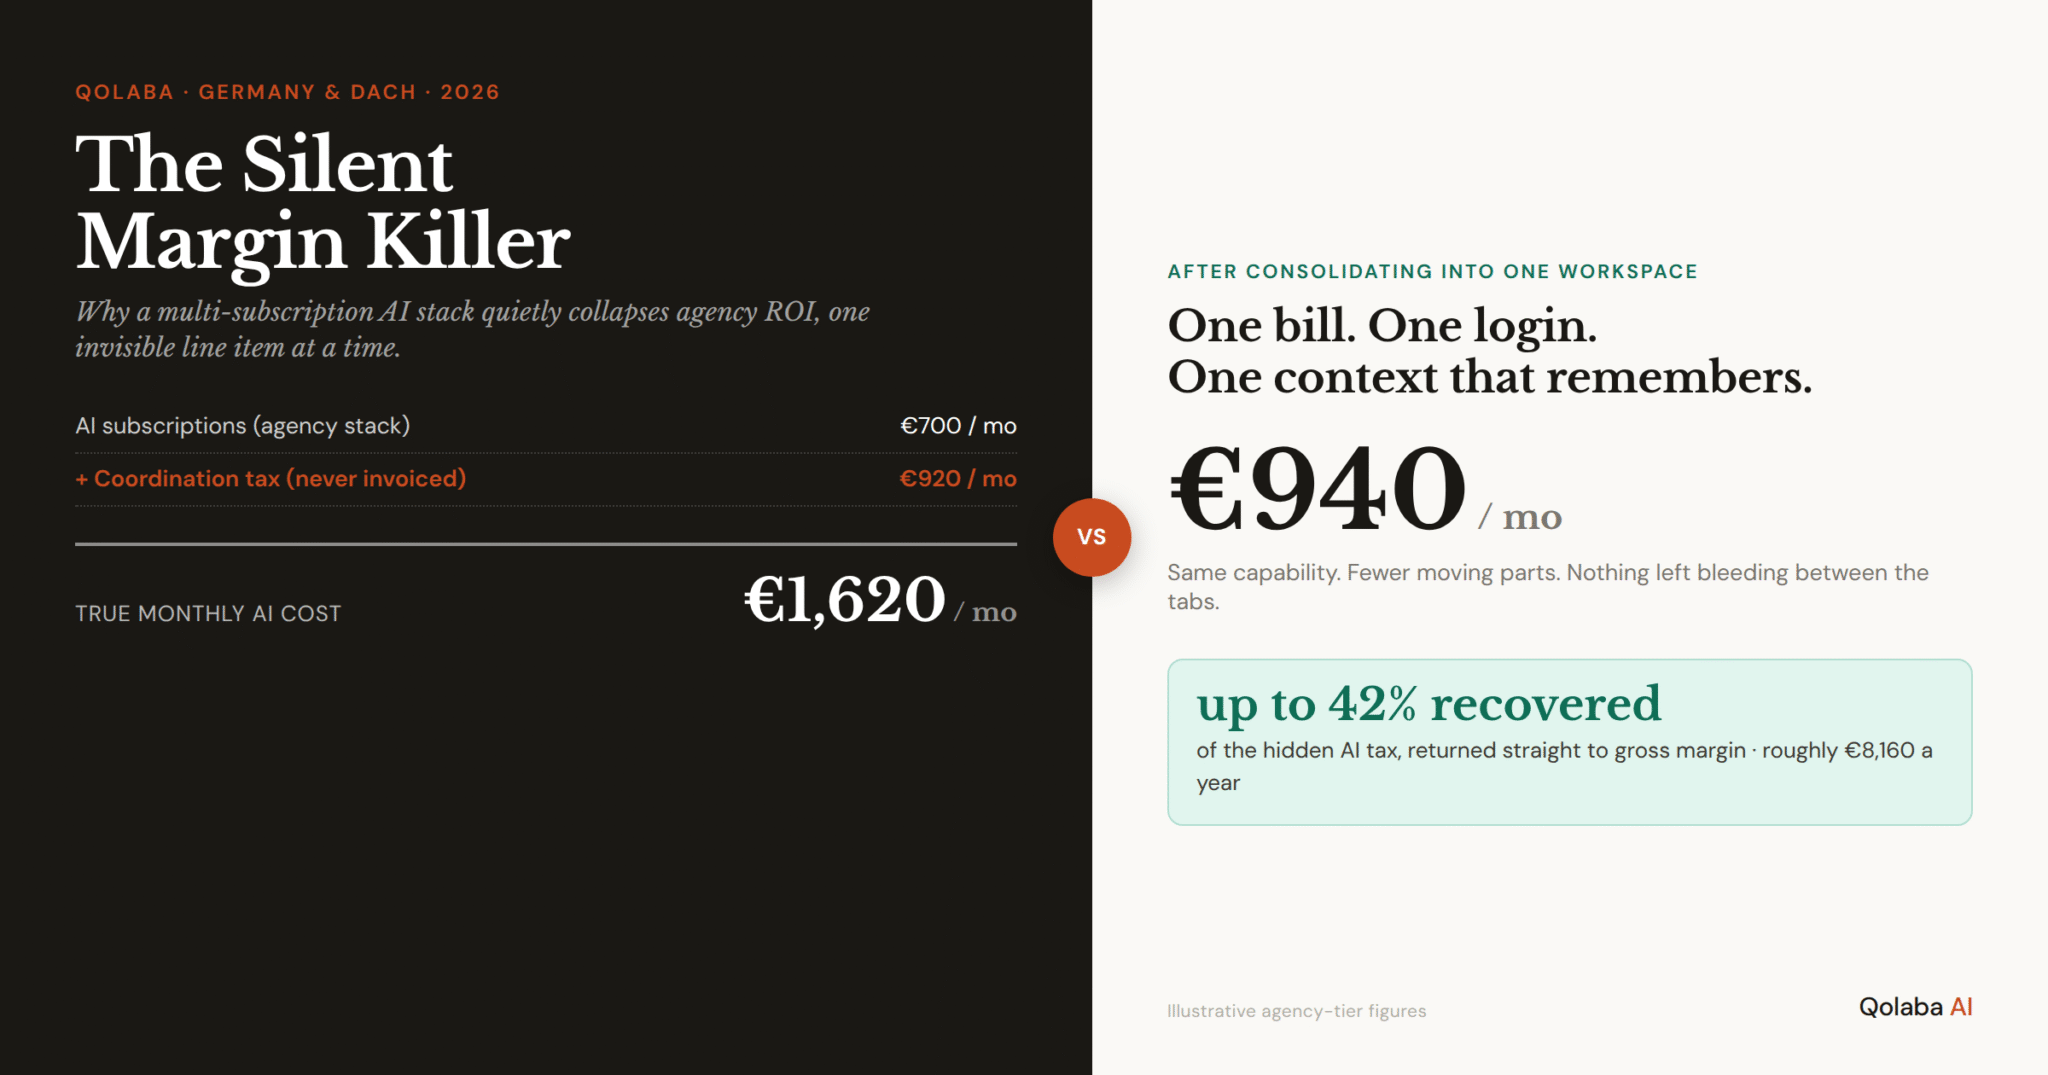
- Cost Reduction: Savings from reduced manual labor, optimized resource allocation, or fewer errors.
- Example: “Automated data entry reduced operational costs by 10% in the finance department.”
- Error Reduction Rate: Decrease in human errors in tasks where AI assists or automates.
- Example: “AI-assisted code review reduced critical bugs by 25% before deployment.”
- Throughput Increase: Higher volume of tasks completed within the same timeframe.
- Example: “AI-driven customer service handled 30% more inquiries without increasing headcount.”
2. Business Impact & ROI Metrics
These connect AI directly to strategic business goals.
- Revenue Generation: Increase in sales, lead conversion rates, or average deal size attributed to AI.
- Example: “AI-personalized marketing campaigns increased lead-to-customer conversion by 8%.”
- Customer Satisfaction (CSAT/NPS): Improvement in customer experience due to AI-powered interactions or faster service.
- Example: “AI-driven chatbot improved customer satisfaction scores by 5 points for common queries.”
- Employee Productivity: Time freed up for strategic work, leading to higher output or innovation.
- Example: “Teams using AI for research reported 15% more time available for creative problem-solving.”
- Market Share/Competitive Advantage: Gains in market position or ability to outpace competitors.
- Example: “Faster market insights from AI-driven analysis led to launching a new product feature 3 months ahead of competitors.”
3. AI Performance Metrics (Technical)
For the AI models themselves, these ensure the technology is performing as expected.
- Accuracy/Precision/Recall: How well the AI model performs its specific task (e.g., classification, prediction).
- Model Drift: How the model’s performance changes over time, indicating a need for retraining.
- Latency/Response Time: Speed at which the AI processes requests.
- Resource Utilization: Cost and efficiency of the computing resources used by the AI.
4. Adoption & Usage Metrics
These track how widely and effectively AI is being utilized within the organization.
- Active Users: Number of unique individuals engaging with AI tools.
- Feature Usage: Which specific AI capabilities are being used most often.
- Workflow Integration Rate: How often AI is incorporated into standard operating procedures.
- Training Completion Rates: Percentage of users who have completed AI training.
5. Risk & Compliance Metrics
Monitoring these ensures AI is used responsibly and securely.
- Data Security Incidents: Number of breaches or exposures related to AI use.
- PII Exposure Alerts: Instances where personally identifiable information was detected in AI inputs/outputs.
- Compliance Adherence: Adherence to data privacy regulations (GDPR, HIPAA) in AI workflows.
Building Your AI Impact Reporting Framework
- Define Clear Objectives: Before tracking, clarify what you want AI to achieve for each use case.
- Establish Baselines: Measure current performance before AI implementation to prove improvement.
- Select Relevant Metrics: Don’t track everything. Choose 3-5 key metrics per AI initiative that directly tie to objectives.
- Implement Tracking Tools: Integrate analytics into your AI platforms or use specialized AI monitoring tools.
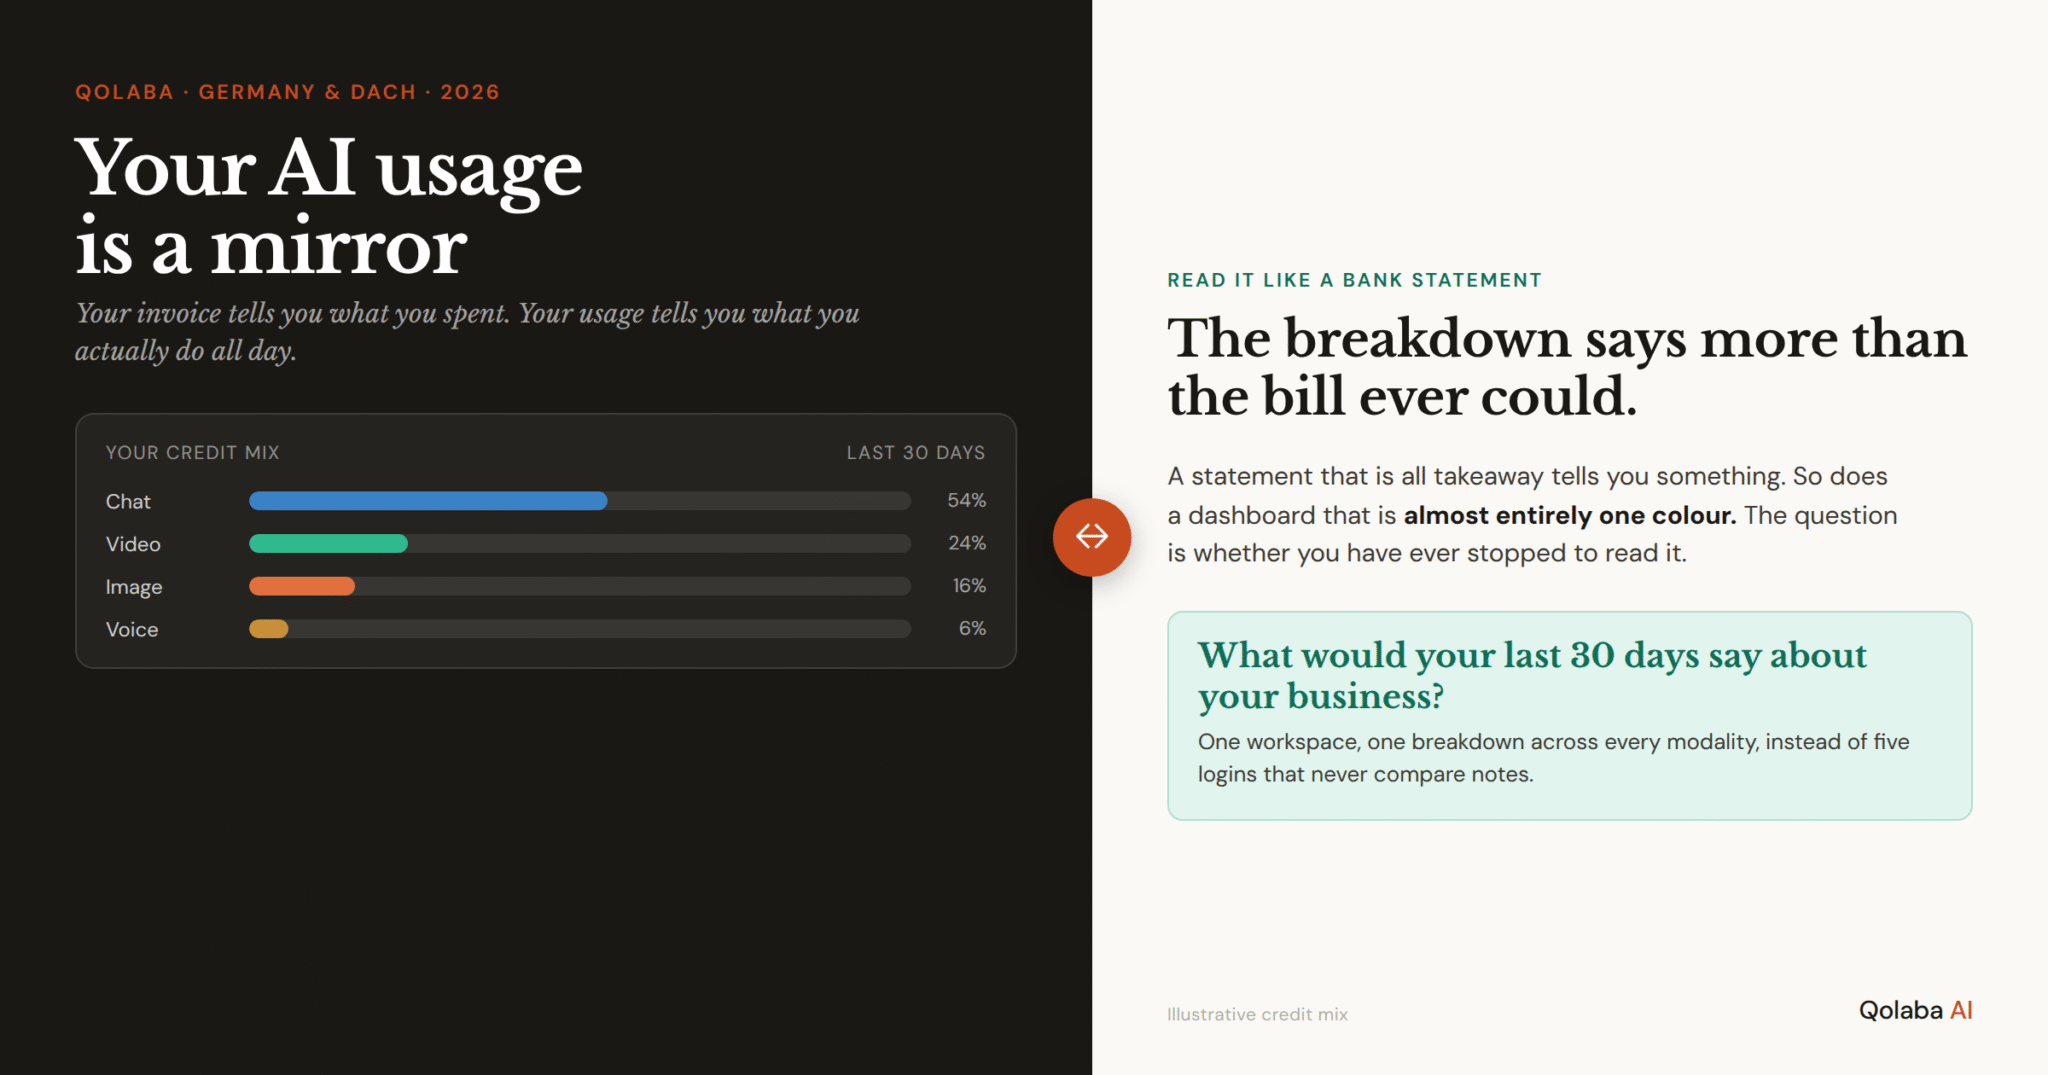
- Create Dashboards: Visualize key metrics in an easily digestible format for different audiences (executives, team leads, users).
Best Practices for Reporting AI Impact

- Contextualize Data: Numbers alone aren’t enough. Explain why a metric is important and what it means for the business.
- Focus on Business Outcomes: Translate technical metrics into business language (e.g., “95% accuracy in lead scoring led to a 10% increase in qualified leads”).
- Segment by Use Case/Team: Report on the impact of AI in specific departments or for particular tasks to identify successes and areas for improvement.
- Regular Reviews: Schedule weekly, monthly, or quarterly reviews of AI performance with relevant stakeholders.
- Iterate and Adapt: AI is constantly evolving. Your metrics and reporting framework should evolve with it.
The Path to Data-Driven AI Success
Measuring AI impact isn’t a one-time task; it’s an ongoing process that fuels continuous improvement and strategic growth. By systematically tracking the right metrics and communicating their significance, you can move beyond anecdotal evidence to demonstrate the true, quantifiable value of AI across your organization. This data-driven approach transforms AI from an experiment into a core driver of business success.
Ready to gain complete visibility into your AI’s performance and impact? Platforms like Qolaba provide comprehensive analytics dashboards that track usage, performance, and ROI across all teams and AI workflows. With detailed monitoring of every AI interaction, workspace-level insights, and credit usage optimization tools, you can transform AI from an expense into a measurable competitive advantage—all while ensuring your AI initiatives align with your strategic business goals.